Category: Alpaca Husbandy Breeding & Genetics
-
EPD’s …How Accurate is Accurate enough?
There’s some confusion about the term “accuracy” when it comes to EPD’s. It would make…
-
 Alpaca Fiber, Alpaca Husbandy Breeding & Genetics, Alpaca Marketplace, Alpaca Shows, Herdsire Breedings
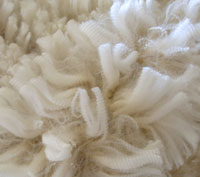
How does fiber diameter affect fleece weight and density?
It took us a few years to catch on to the degree fiber diameter plays on fleece…
-
What Are EPD’s (Expected Progeny Difference)
EPD’s represent the breeding value of an animal based upon it’s own merit and production along…